


Pageviews? That’s yesterday’s news. Here’s why.
In the digital landscape, it’s often said that “content is king.” Yet, it’s not just about flaunting the crown. It’s the relationship with your audience that truly counts. If you’re solely fixated on pageviews, you might be overlooking some crucial insights.
Welcome to the world of content engagement metrics.
TL;DR
- Content is more than just attracting readers; it’s about engaging them.
- Counting pageviews alone misses vital insights on user engagement.
- Modern content encourages interaction: reactions, comments, shares, and contributions.
- Going beyond SEO filler content is vital; aim to resonate with the audience for meaningful engagement.
- Engagement metrics guide in understanding audience preferences and content effectiveness.
Why You Should Look Beyond Pageviews
Think of it this way: imagine you’ve just opened a hip new café downtown. Folks wander in, peruse the menu, and maybe even stick around for a while. But if all you’re doing is tallying the foot traffic, you’re glossing over some critical details. Are they raving about the caramel latte? How do they rate your WiFi connection? What’s their take on the background music?
In the same vein, with your digital content, a simple click on your article or post doesn’t give you the full picture. Did readers find value in it, or share it? Did they even linger long enough to really grasp the main points? Limiting your focus to pageviews is just like valuing the people that window-shopped at your café, but didn’t actually get the full experience.
Modern-day content is vibrant and alive. It’s more than just words—it’s an invitation to get involved. People want to engage with good content; they react, comment, share, and even contribute. So, if we’ve only got our eye on the surface metrics, we risk missing the treasure trove of insights lurking in the depths.
Why This Shift in Metrics Matters
Data doesn’t tell stories, which is precisely why we champion a content creation process that blends sharp AI intelligence with the irreplaceable human touch. Churning out SEO filler content isn’t going to cut it anymore—now, you need to focus on resonating with your audience, every time.
Engagement metrics are our roadmap to doing just that: tracking the trends, discerning your audience’s preferences, and delivering that to them. If you’re serious about evolving in the content sphere, it’s high time to embrace what genuinely matters in content metrics.
Engagement Metrics to Track
1. Time on Page (ToP)
Definition: How long your visitors tend to spend on a particular page.
Deduction: A long ToP suggests your visitors are engaged in what they’re reading.
Example: Say you wrote an extensive guide on ‘How to Boost E-commerce Sales.’ If your average ToP is seven minutes, and the guide takes roughly 7-8 minutes to read, it is safe to assume that your readers are finding it interesting enough that they’ll read to the end.
Here are Frank Spear from WPBeginner‘s two cents:
“ToP is a crucial content marketing engagement metric that you need to track, regardless of your industry. Simply put, ToP is an excellent measurement tool for figuring out how much people like your content and whether your website is working properly.
For example, if your ToP drops from 30 seconds to one second overnight, you should make sure the page loads quickly and looks good on mobile. There’s a chance something went wrong if your ToP drops this quickly over a short period of time.
Besides making sure your site is working as intended, I recommend tracking this metric because it will help you figure out if the content on your site matches the goals, pain points, and interests of your target audience. If people find your content relevant and helpful, you should have no problem improving ToP.”
2. Bounce Rate
Definition: The percentage of visitors who leave your site after viewing just one page.

Deduction: A high bounce rate means your content didn’t resonate or meet the visitor’s needs. However, in some cases, a high bounce rate may not necessarily be negative. For instance, if the user found the information they needed on that single page and didn’t need to explore further.
Example: Perhaps you posted a blog entitled ’10 Tips for Healthy Living,’ but it has earned a bounce rate of 85%. For some reason, people are navigating away after seeing this page, indicating that visitors didn’t find the tips helpful, or the content wasn’t what they were expecting based on the title or search query.
3. Scroll Depth
Definition: How far down a page visitors scroll.
Deduction: The farther visitors scroll, the more likely they are to be engaged.
Example: Scroll depth is a particularly useful metric for long reads and landing pages. Take a lengthy article on ‘AI for Content Creation.’ If 70% of your visitors are scrolling down to at least 75% of the page, you can bet that they found it interesting.
Here’s what Sudhir Khatwani, Founder of The Money Mongers, has to say about scroll depth:
“When users engage with multiple pages in one session or scroll extensively on a single page, it’s a strong indicator of content engagement. Monitoring these metrics helps us craft engaging content journeys, improve user experience and subsequently, enhance conversion rates.”
4. Social Shares & Comments
Definition: How often your users comment on your content directly or share it with other people on their social platforms.
Deduction: The more shares and comments, the better.
Example: You wrote a post on LinkedIn about an AI conference you went to, and it got 80 likes, a couple of generic comments, and one share. Not bad. The following week, you publish an opinion piece on ‘The Future of AI-Driven Marketing.’ Over 1,200 people share it and there’s an ongoing discussion in the comment section—a roaring success. Here, you can assume the second piece sparked the most interest.
5. Conversion Rate & Signups
Definition: The percentage of visitors who take a specific desired action after engaging with your content on your site. These actions may vary based on your business objectives and can include activities such as signing up for a newsletter, making a purchase, downloading a resource, or even making a phone call.
Deduction: The higher the percentage, the more effective your content is.
Example: After reading your case study on how ‘Hybrid Content Creation Boosts Brand Visibility,’ 5% of the readers signed up to learn more at your webinar. They were engaged enough to take the next step.
Levi Olmstead, Director of Content Marketing at Whatfix, shares his thoughts;
“At Whatfix, we wanted a metric to understand which of our ToFu blogs and articles were actually moving users through the funnel. So, we started thinking, ‘What pieces of content are pushing visitors to a ‘high-intent action’ on our website?’
We classify a high-intent action as actions that take users further down the funnel, show signs they’re interested in a digital adoption platform (DAP), or visit a high-conversion page. Examples include our case studies, DAP use cases, our digital adoption platform educational content, and our customer page.”
6. Click-Through Rate (CTR)
Definition: The ratio of users who click on a specific link to the total number of users who view the content, be it a page, an ad, or an email.
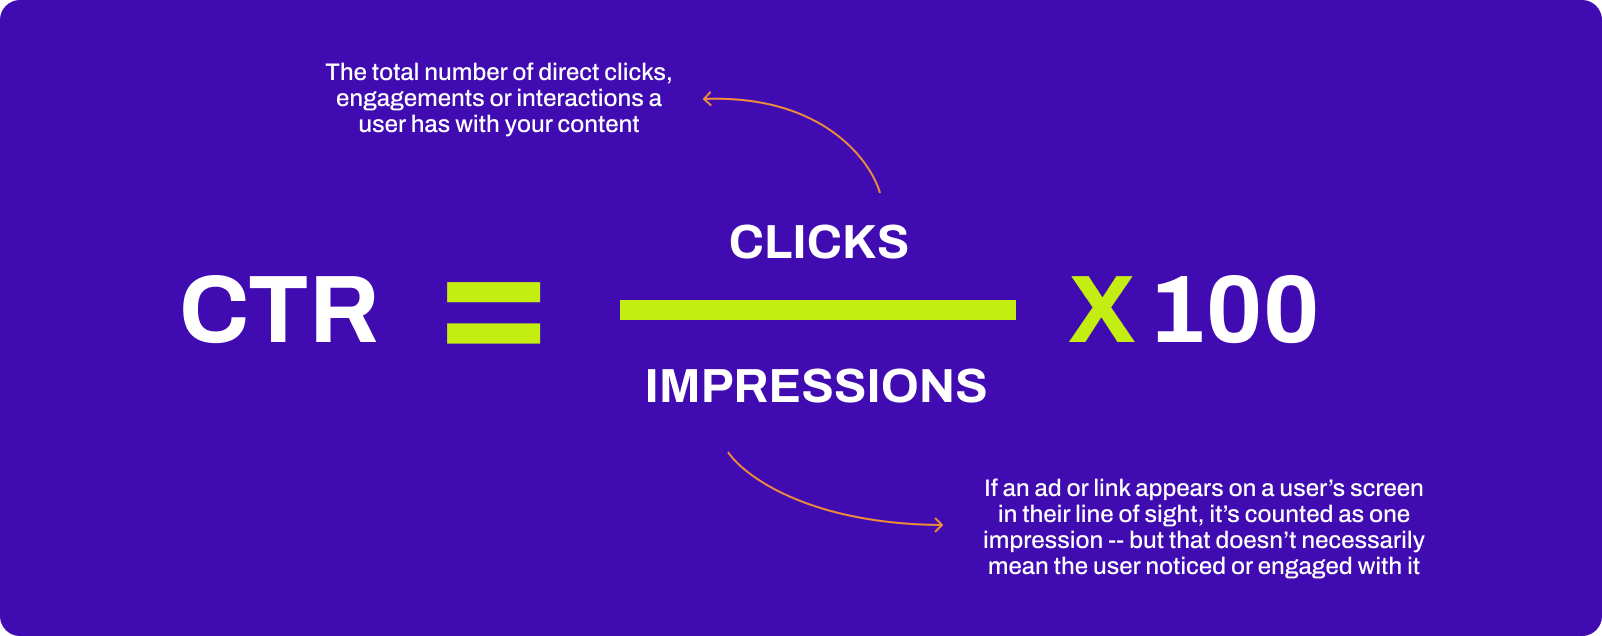
Deduction: The higher the percentage, the more enticing your content is looking.
Example: Last week, you sent out an email sequence to your client base with promotional information about a new AI content creation service. Upon review, you discover that 10% of recipients clicked on the “Learn More” link at the bottom.
With email marketing, CTR can greatly vary based on the industry, content, audience, and nature of the email. The average CTR for emails across industries hovers at around 3%. So, achieving a 10% CTR is significantly higher than the industry average, potentially down to your compelling content that resonated strongly with your specific audience.
7. Return Visitors
Definition: How many of your site’s visitors are returning compared to new visitors.
Deduction: A high return visitor rate suggests your content is engaging enough to bring readers back for more.
Example: You’re running a blog on all things lifestyle, and over the course of a month, your analytics show that 40% of visitors are not new ones, but returning. This indicates strong retention and consistent value delivery.
8. Average Session Duration
Definition: The average amount of time a visitor spends on your website during a single session
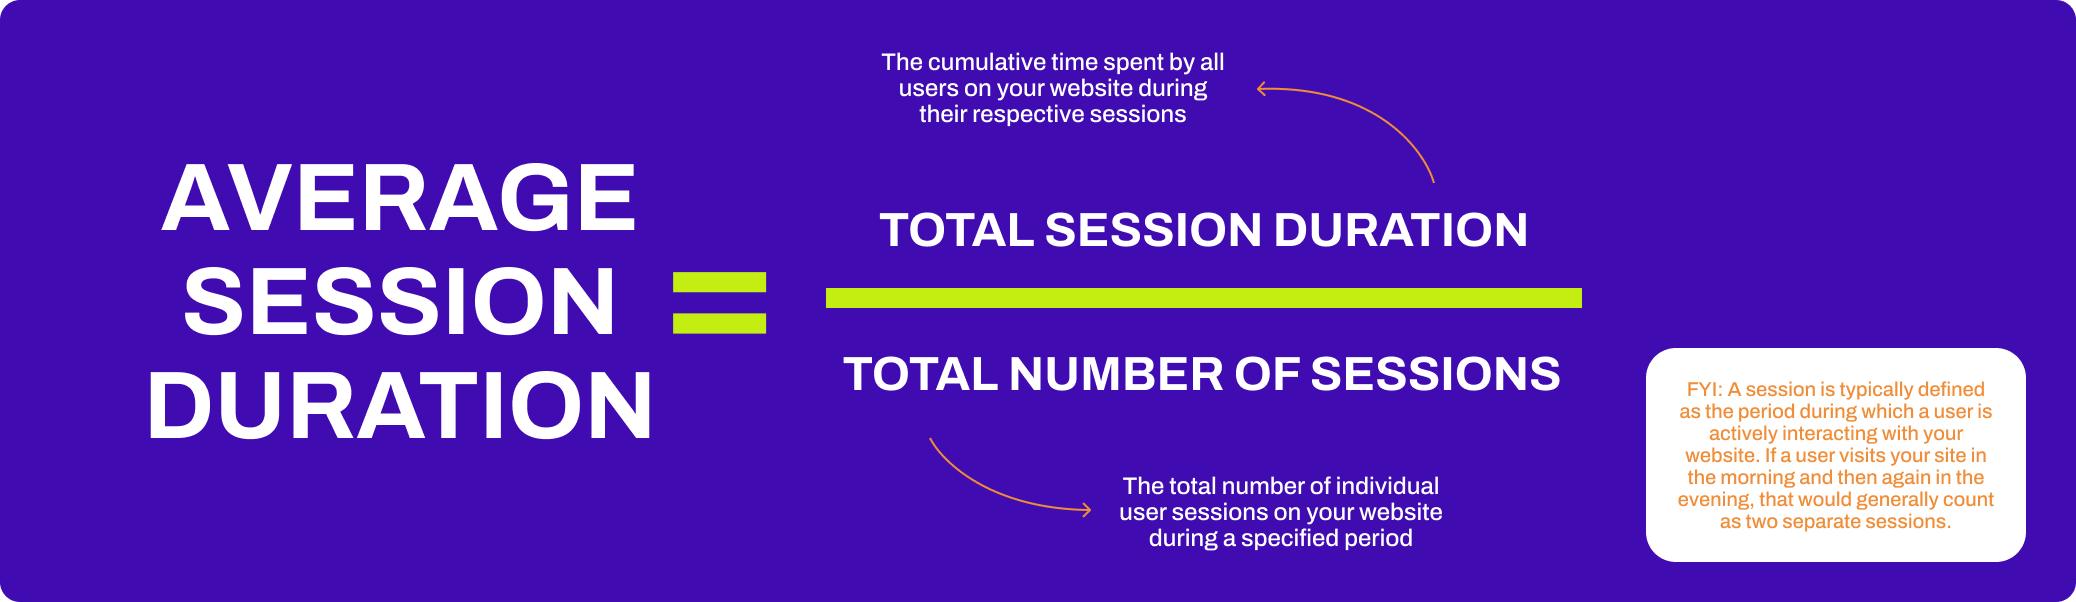
Deduction: The longer the session, the better you are at engaging your audience.
Example: Your analytics show that visitors spend an average of four minutes on your website, perusing through articles on ‘The Synergy of AI and Human Creativity.’ This suggests that visitors are seeing multiple articles of interest and are taking their time to read through them.
9. Pages per Session (PPS)
Definition: The average number of pages a user browses during a single session.
Deduction: A high PPS suggests that users are deeply exploring your website and consuming multiple pieces of content.
Example: On reading an article titled ‘The Evolution of Content Creation’, users further explore three related articles on average. This reflects that the primary content ignited curiosity in other topics on your site.
10. Exit Rate
Definition: The frequency at which users depart from a specific page, often being the concluding content they engage with.
Deduction: A high exit rate means users find that content to be a satisfying endpoint.
Example: You published an article entitled ‘Maximizing Engagement Metrics’ and it shows a 75% exit rate. This hints that a large portion of readers might wrap up their browsing with this piece, possibly implementing the insights they’ve gathered.
11. Newsletter Sign-ups
Definition: The volume of users subscribing or signing up for your newsletter.
Deduction: The more sign-ups, the safer it is to assume your content is valuable and relevant.
Example: Post launching a series titled “The Science Behind Content Engagement”, newsletter subscriptions skyrocket by 200%. This surge indicates the content series resonated significantly with readers.
Zeeshan Akhtar, Head of Marketing at Mailmodo, shared the following:
“Measuring content performance is important to understand the impact of your content pipeline as well as your team. We at Mailmodo connect our content with sign-ups as the top-level metric, which helps us determine which content has a good business impact. This essentially involves optimizing content for quantitative metrics like Search clicks, Search CTR, Search Impressions, Engagement rate (from GA4), and dwell time. We also optimize for quantitative metrics like readability, quality, and expertise of the content. This helps us drive business results from content.
Initially, when we started measuring this, we realized that there were specific folders like email templates and others that were producing sign-ups, but our team was not focused on those. Once we started measuring it, we started putting effort into those types of pages as well to double down on the signups from there.”
12. Feedback and Polls
Definition: A tool for gathering direct user insights on your content’s reception.
Deduction: High positive feedback means the content is resonating.
Example: You published an article discussing ‘AI-driven Engagement Metrics for the Future’, and a whopping 90% of poll takers said that the piece was ‘Extremely Helpful’, showing just how well it resonated with your audience.
Polls and audience feedback are particularly valued tools at rockee.io, as Founder Matt Laybourn explains:
“We’ve done a lot of research with marketers on how they use analytics metrics to measure content performance. It’s the usual responses of things like the value of dwell time, bounce rate, and events and conversions. But there is a problem: other than events and conversions being completed from the content (which indicates it clearly influenced an action), the rest of the metrics often lead to guesswork.
Bounce rate, for example, isn’t a bad thing—someone could have read the content, then left. You don’t know! Dwell time is only a proxy to performance, someone could have got the answer they needed in one minute—that doesn’t mean the content was bad.
Our approach to content effectiveness is to get feedback from the audience. They can rate our content (1-5) and leave feedback. This way we understand if the content was genuinely helpful, and if not, how we can improve it.
It’s made measurement and optimization easier for us, and takes the guessing game out of numbers alone – now we have the answers behind them.”
13. Video and Multimedia Engagement
Definition: Engagement rates for embedded multimedia components (such as videos), including views, average watch time, and interaction rates.
Deduction: The higher the engagement rates, the richer the user experience.
Example: Your recent article entitled ‘The Human-AI Partnership in Content Creation’ has an embedded video halfway down the page, which sees an impressive 80% play rate, with 70% of those viewers watching till the end. This means the video added serious value to the content.
14. Interaction with Downloadable Resources
Definition: The frequency at which users download resources like e-books, whitepapers, or infographics.
Deduction: The higher the download rate, the more value users perceive your content to have.
Example: A new and interesting whitepaper titled ‘Deciphering the Complex Landscape of Modern Content Metrics’ amasses a huge 5,000 downloads in its first week. Audiences clearly found it appealing.
15. Referral Traffic
Definition: External platforms that guide traffic toward your content.
Deduction: An array of high-grade referral sources points to extensive content engagement and appeal.
Example: An investigative piece on ‘Ethical Dilemmas in AI Content Creation’ garners extensive shares on specialized forums, resulting in a 300% boost in referral traffic. This showcases the content’s broad appeal in the industry spectrum.
Let’s Wrap Up
In a time where data reigns supreme, content engagement metrics are like Pandora’s box for those willing to delve deeper than pageviews alone. crucial. As we’ve explored, from time on page to referral traffic, each metric offers a unique lens into content performance. For businesses like ours, committed to the blend of AI precision and human creativity, these metrics help refine our strategies, ensuring we resonate with our audience effectively.
Harness the power of these metrics, and you can tailor your business’s content strategy to secure higher engagement and foster deeper connections with your audience. After all, in the dynamic landscape of content creation, understanding your audience’s engagement is not just beneficial—it’s essential.

